Plotting locations sent in 'WhatsApp' chat logs on maps
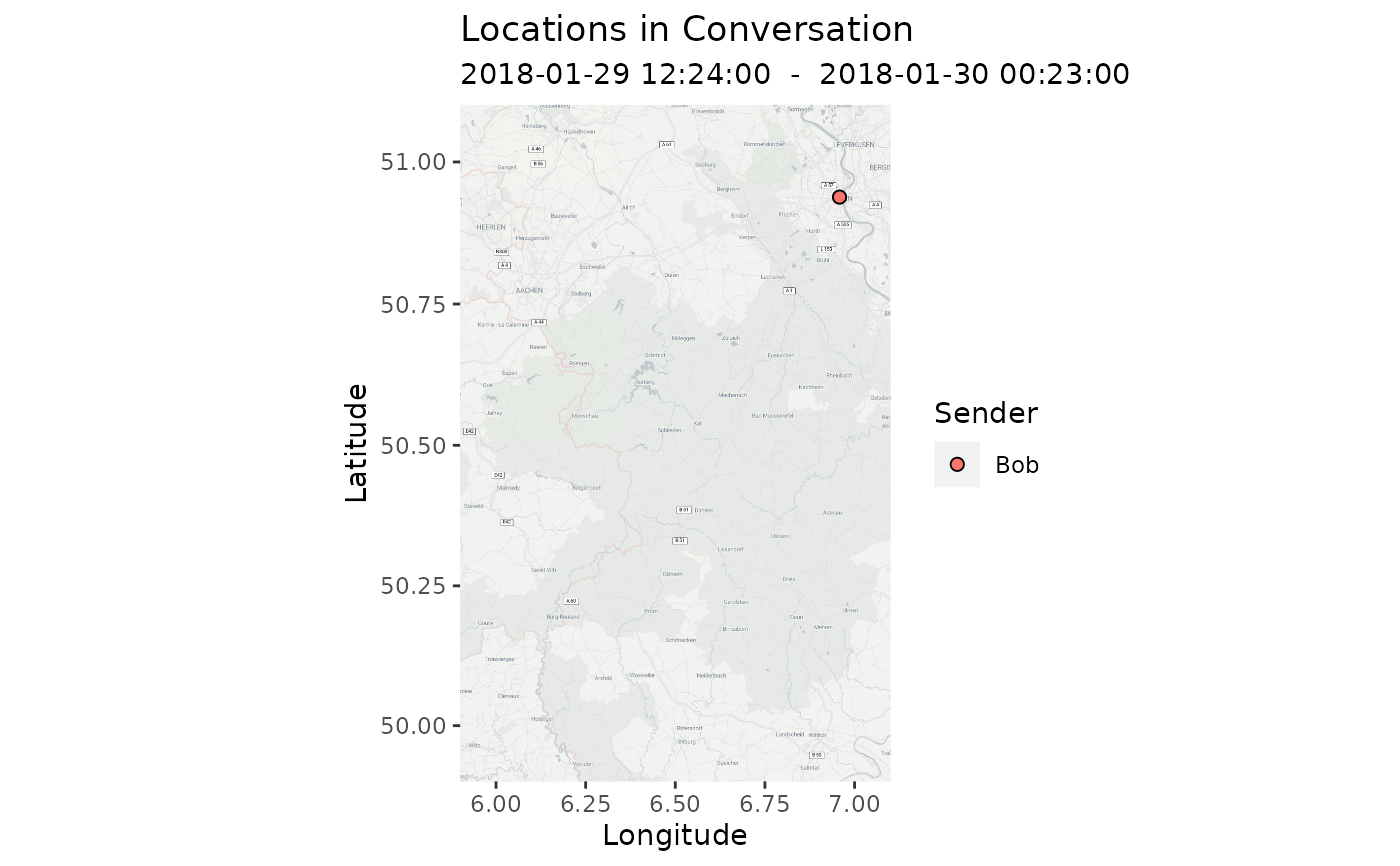
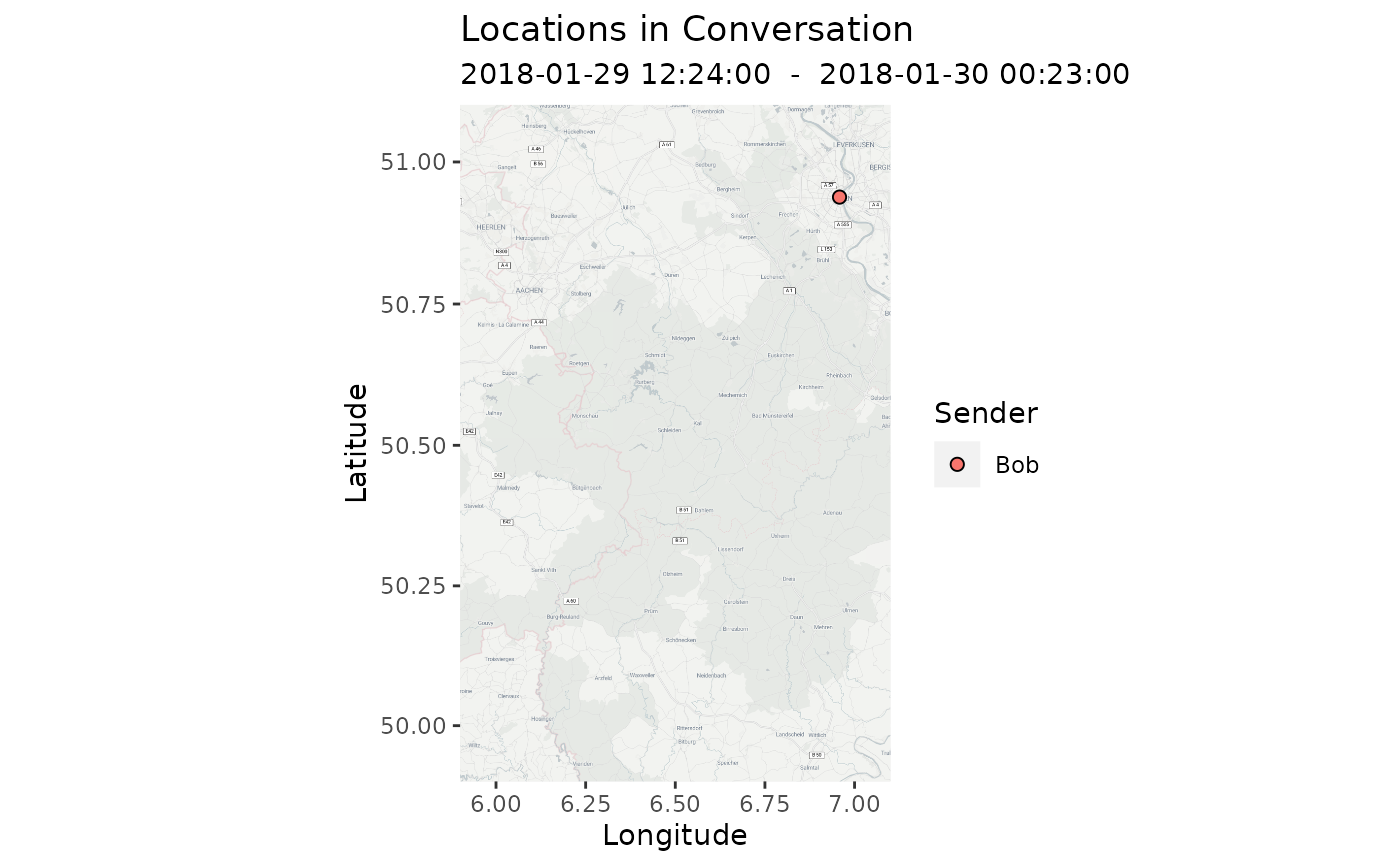
plot_locations.RdPlots the location data that is sent in the 'WhatsApp' chatlog on an auto-scaled map. Requires unanonymized 'Location' column in data
plot_locations(
  data,
  names = "all",
  starttime = "1960-01-01 00:00",
  endtime = "2200-01-01 00:00",
  mapzoom = 5,
  return_data = FALSE,
  jitter_value = 0.01,
  jitter_seed = 123,
  map_leeway = 0.1,
  exclude_sm = FALSE,
  API_key = "fbb7105f-27c1-49a0-96f8-926dfddcae32",
  map_type = "alidade_smooth"
)
Arguments
- data
A 'WhatsApp' chatlog that was parsed with
parse_chatwith anonymize= FALSE or anonymize = "add".- names
A vector of author names that the plots will be restricted to.
- starttime
Datetime that is used as the minimum boundary for exclusion. Is parsed with
as.POSIXct. Standard format is "yyyy-mm-dd hh:mm". Is interpreted as UTC to be compatible with 'WhatsApp' timestamps.- endtime
Datetime that is used as the maximum boundary for exclusion. Is parsed with
as.POSIXct. Standard format is "yyyy-mm-dd hh:mm". Is interpreted as UTC to be compatible with 'WhatsApp' timestamps.- mapzoom
Value for zoom into the map passed down to
get_map. Default value is 5. Higher zoom will auto-download more map files which can take a while.- return_data
If TRUE, returns a data frame of LatLon coordinates extracted from the chat for more elaborate plotting. Default is FALSE.
- jitter_value
Amount of random jitter to add to the geolocations to hide exact locations. Default value is 0.01. Can be NA for exact locations.
- jitter_seed
Seed for adding random jitter to coordinates. Passed to
set.seed- map_leeway
Adds additional space to the map so that points do not sit exactly at the border of the plot. Default value is 5.
- exclude_sm
If TRUE, excludes the 'WhatsApp' system messages from the descriptive statistics. Default is FALSE.
- API_key
API key for
register_stadiamaps. Default is "fbb7105f-27c1-49a0-96f8-926dfddcae32". See also: https://rdrr.io/cran/ggmap/man/register_stadiamaps.html- map_type
Type of map to be used. Passed down to
get_stadiamap. Default is "alidade_smooth".
Value
Plots for geolocation and/or a data frame of latitude and longitude coordinates
Examples
data <- readRDS(system.file("ParsedWhatsAppChat.rds", package = "WhatsR"))
plot_locations(data, mapzoom = 10)
#> ℹ © Stadia Maps © Stamen Design © OpenMapTiles © OpenStreetMap contributors.

